Integrating Databricks with Atomic
Databricks is usually where the signal lives. A balance crosses a threshold, a risk score changes, a model scores a customer as likely to churn. Atomic is where you act on it: a card in your app, with a response that comes back.
This guide covers both directions of that round trip.
- Databricks to Atomic: start an Action Flow when data in your lakehouse meets a condition you care about.
- Atomic to Databricks: land Atomic's analytics events and card responses in Delta tables so the next decision can use them.
Before you start
In Atomic:
- Edit-level permissions on Action Flows, credentials, and API keys.
- For the write-back paths, an API key. See API keys.
In Databricks:
- A Unity Catalog enabled workspace.
CREATE CONNECTIONon the metastore if you use the SQL pattern, and permission to create a secret scope and jobs.- Databricks Runtime 16.2 or above for
http_request(), or a Pro or Serverless SQL warehouse.
Allow outbound access to Atomic from Databricks
This is the step that most often causes a silent failure, so do it first.
If your Databricks account has a serverless network policy in Restricted access mode, outbound connections from serverless compute are denied by default. That covers notebooks, jobs, SQL warehouses, Lakeflow pipelines, Model Serving and Databricks Apps, so every pattern in this guide is affected.
Network policies are account-level objects, so this is done in the Databricks account console rather than workspace admin settings, by a Databricks account admin.
First, check whether it applies to you. Every Databricks account has a default policy that covers all workspaces with no explicit assignment, so there is always one in effect:
- Go to the Databricks account console and open Security > Networking.
- Under Policies, click Context-based ingress & egress control.
- Find your workspace and open the policy named in its Network Policy setting.
If that policy's egress mode is Full access, serverless compute already has unrestricted outbound access and there is nothing more to do here.
If it is Restricted access, add your Atomic hosts to the allowlist:
- Edit the attached policy, or create a new one with Create new network policy.
- Open the Egress tab.
- Click Add destination above the Allowed domains list, and add:
<your-org-id>.customer-api.atomic.iomaster-atomic-io.auth.us-east-1.amazoncognito.com, if you are calling the Atomic API rather than a Webhook trigger
- If you created a new policy, attach it to your workspace: select the workspace, click Update network policy, choose the policy, then Apply policy.
To verify the allowlist before enforcing it, turn on dry-run mode in the policy editor. You can enable it for SQL warehouses, model serving endpoints, or all products. Requests that would be blocked are logged instead, so you can confirm Atomic is reachable without risking a silent outage.
Most network policy changes refresh within ten minutes, but switching access modes or changing dry-run mode itself can take up to 24 hours. A policy also caps out at 100 allowed FQDNs. See managing network policies for the full details.
On classic compute, outbound access follows your own VPC egress rules instead, so check your NAT and firewall configuration.
Part 1: triggering Action Flows from Databricks
Add a Webhook trigger in Atomic
Setting this up means moving between the two systems, because Atomic learns the shape of your payload from a real request. The order is:
- Create the trigger in Atomic and copy its URL, below.
- Build one of the patterns in Databricks, pointed at that URL.
- Send a request, then map the payload in Atomic using the sample it captures.
- Test and go live.
Every pattern sends its request to the same place, so you only do steps 1 and 3 once.
To create the trigger:
- In the Atomic Workbench, open the Action Flow you want Databricks to trigger, or create a new one.
- On the Action Flow canvas, add a Webhook trigger. Atomic generates a unique inbound URL. Copy it.
- Select the trigger on the canvas. Its properties open in the panel on the right, including a drop-down for the trigger mode. Leave it on Test mode until you have finished testing.
Because Atomic's payload mapper transforms the incoming request, Databricks does not need to match an Atomic schema. Keep the payload from Databricks simple and shape it inside Atomic.
Send one request containing many customers rather than one request per customer. Atomic accepts a JSON array, see dealing with batched payloads. Every pattern below is written this way.
In the Atomic Workbench, click your avatar in the bottom left and select Copy my test customer ID. Use that ID in place of a real customer while the trigger is in Test mode.
Choosing a pattern to use in Databricks
| Pattern | Latency | Compute | Best for |
|---|---|---|---|
A. http_request() from SQL | However often you schedule it | SQL warehouse | Threshold queries, no code to maintain |
| B. Structured Streaming | Seconds on classic compute, otherwise per run | Streaming job | High volume, full control over batching and retries |
| C. Event-driven job triggers | Under a minute | Job compute, on demand | Real time enough, without always-on compute |
If you are not sure, start with C. It gets you close to real time without paying for a continuously running cluster. Move to B when you want the change feed and micro-batch control, and note that seconds-level latency there means running it on classic compute, because serverless does not allow always-on triggers.
Set up a table to follow along with
This section only creates an example table so the code in the patterns below runs as written. If you already have a schema and a table holding the customers you want to target, substitute your own names and columns throughout and go straight to your chosen pattern.
All three patterns query an example table called <your-catalog>.banking.accounts. Create it with:
CREATE SCHEMA IF NOT EXISTS <your-catalog>.banking;

CREATE TABLE IF NOT EXISTS <your-catalog>.banking.accounts (
  user_id STRING,
  balance DECIMAL(18,2)
)
-- Patterns B and C read the change data feed. Enabling it at creation means the
-- feed covers the table's whole history, rather than starting partway through.
TBLPROPERTIES (delta.enableChangeDataFeed = true);

INSERT INTO <your-catalog>.banking.accounts VALUES
  ('<your-atomic-test-customer-id>', 42.00);
Replace <your-catalog> with a catalog that exists in your workspace. There is no single default name: workspaces that Databricks enabled for Unity Catalog automatically get a catalog named after the workspace, often just workspace, while workspaces enabled manually or before automatic enablement get one called main. The catalog selector at the top of the SQL editor shows which one you are in, or run SELECT current_catalog(). The same substitution applies to every example in this guide.
The schema does not exist yet, which is why it is created first. You need CREATE SCHEMA on the catalog. If you would rather not create one, every catalog has a default schema you can use instead.
For the customer ID, use your own Atomic test customer ID from the Workbench, so a successful run targets you rather than a real customer. A balance under 100 is what the example queries look for.
Pattern A: call Atomic from SQL with http_request()
http_request() lets a Databricks SQL query call an external endpoint directly. It is the least code of any pattern here, and the most limited: it is rate limited and intended for interactive use rather than high-volume batch work.
In Databricks: store the Atomic webhook URL in a connection
An Atomic Webhook URL contains a hard-to-guess token (aka the "secret"), so the URL itself acts as a bearer secret. In Databricks, put it in a Unity Catalog HTTP connection so it stays out of your query text.
You need CREATE CONNECTION on the Unity Catalog metastore. Run the SQL below from a Databricks notebook or the SQL editor:
CREATE CONNECTION atomic_webhook TYPE HTTP
OPTIONS (
  host         'https://<your-org-id>.customer-api.atomic.io',
  port         '443',
  base_path    'the rest of your Atomic webhook URL path i.e. /<your-env-id>/connector/<action-flow-id>/<secret>',
  bearer_token 'unused'
);
bearer_token is required, even though it is not needed on a webhookDatabricks HTTP connections have no "no authentication" option, and leaving the credential options out does not give you one. A placeholder such as bearer_token 'unused' satisfies the requirement. Atomic authenticates the request from the connector secret in the Atomic webhook URL path and does nothing with the Authorization header the connection adds.
Grant access narrowly, because anyone who can describe the connection can read base_path. Either run the SQL, or open the connection in Catalog Explorer and use its Permissions tab:
GRANT USE CONNECTION ON CONNECTION atomic_webhook TO `<your-databricks-group-or-user>`;
Substitute a group or user that already exists in your workspace, for example `me@example.com` while you are testing. Granting to a group that does not exist fails with PRINCIPAL_DOES_NOT_EXIST. You do not need this grant at all if you own the connection and are the only one querying it.
Databricks joins the connection's base_path with the path argument of each request, so the two together must add up to your full trigger path. If a test call comes back as a 404, move the last segment of the URL out of base_path and pass it as path instead.
base_path cannot be a secret() reference, so the token is visible to Databricks users who can run DESCRIBE CONNECTION EXTENDED. Restrict USE CONNECTION and connection ownership accordingly, and treat the URL as a credential. If that is not acceptable in your environment, use Pattern B or C, where the URL comes from a secret scope instead. See securing the connection.
In Databricks: send one batched request
Aggregate the matching customers into a single JSON array, then make one call to Atomic. Record the outcome so a later step can tell what was sent:
CREATE TABLE IF NOT EXISTS <your-catalog>.banking.atomic_send_log (
  sent_at        TIMESTAMP,
  user_ids       ARRAY<STRING>,
  status_code    INT,
  response_body  STRING,
  -- Only Pattern C writes this, as its watermark. Leave it null in Pattern A.
  source_version BIGINT
);
-- Sends one batched request to Atomic covering every customer whose balance has
-- dropped below 100, and records who was sent to along with Atomic's response.
-- The aggregate is deliberate: it keeps the run to a single http_request() call
-- however many customers matched, which matters because http_request() is rate
-- limited.
INSERT INTO <your-catalog>.banking.atomic_send_log (sent_at, user_ids, status_code, response_body)
WITH pending AS (
  SELECT
    collect_list(user_id) AS user_ids,
    to_json(collect_list(named_struct(
      'targetUserId', user_id,
      'balance',      balance
    ))) AS payload
  FROM <your-catalog>.banking.accounts
  WHERE balance < 100
  -- Skip the run entirely when nobody matched, rather than posting an empty batch
  HAVING count(*) > 0
)
SELECT
  current_timestamp()  AS sent_at,
  user_ids,
  response.status_code AS status_code,
  response.text        AS response_body
FROM (
  SELECT
    user_ids,
    http_request(
      conn   => 'atomic_webhook',
      method => 'POST',
      path   => '/',
      json   => payload
    ) AS response
  FROM pending
);
The HAVING count(*) > 0 matters. Without it, a run where nothing matched still posts an empty batch to Atomic.
Expect the first run to fail. Atomic does not yet know how to read what you sent, so response_body will report a payload mapping error. That is the next step, not a problem: see map the incoming payload in Atomic, which uses this query's output as the sample to map against. Come back here once the mapping is saved.
Once the mapping works, schedule the query as a SQL task in a Databricks job. In the left navigation of your workspace, click Jobs & Pipelines, create a job, add the query as a SQL task, then set a schedule under Schedules & Triggers. How fresh the sends are is simply how often that schedule fires, so pick an interval that matches how quickly the underlying data changes.
Because the query has no notion of who it has already contacted, a schedule like that will keep sending to the same customers on every run. Stop duplicate sends covers how to handle that in Atomic rather than tracking it in Databricks.
http_request() per rowhttp_request() is rate limited and requests may be throttled if you run it across many rows in one query. Aggregate first, as above, so a run makes one call regardless of how many customers matched. For anything high volume, use Pattern B.
Pattern B: real-time sends with Structured Streaming
A streaming query reads changes as they land and posts each micro-batch to Atomic. It gives you the most control of any pattern here over batching, retries and what counts as a change worth sending.
How quickly it reacts depends on the compute you run it on, so read choose a trigger and compute type before you settle on this pattern.
In Databricks: enable change data feed
ALTER TABLE <your-catalog>.banking.accounts
  SET TBLPROPERTIES (delta.enableChangeDataFeed = true);
The change data feed adds _change_type, _commit_version and _commit_timestamp so you can react to inserts and updates rather than rescanning the table.
In Databricks: store the Atomic webhook URL as a secret
Patterns B and C read the Atomic webhook URL from a Databricks secret scope, which keeps it out of your notebook source and redacts it from output. Create the scope and add the URL with the Databricks CLI:
databricks secrets create-scope atomic

databricks secrets put-secret --json '{
  "scope": "atomic",
  "key": "webhook_trigger_url",
  "string_value": "your entire Atomic webhook URL i.e. https://<your-org-id>.customer-api.atomic.io/<your-env-id>/connector/<action-flow-id>/<secret>"
}'
There is also a legacy UI for creating scopes at https://<your-workspace-host>#secrets/createScope, but adding the secret itself needs the CLI or the Secrets API.
In Databricks: post each micro-batch to Atomic
This pattern runs as a notebook.
1. Create the notebook. Click + New in the left sidebar and select Notebook, or click Workspace, right-click the folder you want it in, and choose Create > Notebook.
2. Check two defaults. The notebook language is whatever you used last rather than Python, so set it with the language selector beside the notebook name. Compute attaches on its own: on a Unity Catalog enabled workspace a new notebook connects to serverless, otherwise pick Serverless from the compute drop-down.
3. Give the stream somewhere to record its progress. The checkpointLocation in the code below is a Unity Catalog volume path, which does not exist until you create it. Any storage location the job can write to works just as well.
CREATE VOLUME IF NOT EXISTS <your-catalog>.banking.pipeline_state;
4. Add the code and run the notebook. It reads the change feed and posts each micro-batch to Atomic. Expect this first run to fail: Atomic has no payload mapping yet, and step 5 covers what to do about it.
import requests
from requests.adapters import HTTPAdapter, Retry

ATOMIC_URL = dbutils.secrets.get(scope="atomic", key="webhook_trigger_url")
BATCH_SIZE = 500

session = requests.Session()
session.mount("https://", HTTPAdapter(max_retries=Retry(
    total=4,
    backoff_factor=1,
    status_forcelist=[429, 500, 502, 503, 504],
    allowed_methods=["POST"],
)))


def post_to_atomic(micro_batch_df, batch_id):
    # Micro-batches can be empty, for example after an OPTIMIZE on the source
    if micro_batch_df.isEmpty():
        return

    rows = (micro_batch_df
            .select("user_id", "balance")
            .dropDuplicates(["user_id"])
            .collect())

    for start in range(0, len(rows), BATCH_SIZE):
        payload = [
            {"targetUserId": r["user_id"], "balance": float(r["balance"])}
            for r in rows[start:start + BATCH_SIZE]
        ]
        response = session.post(ATOMIC_URL, json=payload, timeout=30)
        # Raise so Structured Streaming retries the whole micro-batch
        response.raise_for_status()


(spark.readStream
      .option("readChangeFeed", "true")
      .table("<your-catalog>.banking.accounts")
      .filter("_change_type IN ('insert', 'update_postimage')")
      .filter("balance < 100")
      .writeStream
      .option("checkpointLocation", "/Volumes/<your-catalog>/banking/pipeline_state/checkpoints/atomic_low_balance")
      .foreachBatch(post_to_atomic)
      .trigger(availableNow=True)
      .start())
collect() brings the micro-batch to the driver, which is fine for the volumes most alerting use cases produce. If a single micro-batch can contain hundreds of thousands of customers, send from the executors with foreachPartition instead, and keep the batching so you are not making one request per row.
5. Map the payload in Atomic, then run it again. The first run does reach Atomic. When a change feed stream starts without a startingVersion, it returns the table's current snapshot as insert records before it begins following new changes, so your existing rows count as inserts and anything already matching the filter is sent straight away.
Atomic then rejects that request, because it has no mapping for it yet. raise_for_status() turns the rejection into an exception, which fails the streaming query. Unlike Pattern A, where a mapping error lands quietly in a log table, here it stops the stream, so you will see the HTTP error in the notebook.
Go to map the incoming payload in Atomic and map the request this run captured, then run the notebook again. On that run the notebook shows the streaming progress, processes what is available, and stops, because availableNow ends the query once it has caught up.
That is correct behavior. The checkpoint has advanced past those changes, so there is nothing left to process. To send again, change the data rather than re-running:
UPDATE <your-catalog>.banking.accounts SET balance = 41.00;
That commits an update_postimage record, which the filter matches, so the next run picks it up. Deleting the checkpoint directory also works, but then the whole snapshot is treated as new inserts again.
Avoid sending duplicate cards
This pattern has its own duplicate risk on top of the one every pattern shares. foreachBatch gives at-least-once delivery, so if the stream fails after posting but before committing, the same micro-batch is reprocessed and the same customers are sent to again.
Guard against that in Databricks by recording batch_id in a Delta table and returning early when you see it again. The batch_id argument is stable across retries of the same micro-batch, which is what makes it usable as a key.
Then apply one of the Atomic-side options in stop duplicate sends as a backstop, so a duplicate that slips past the batch_id check still does not become a second card.
In Databricks: choose a trigger and compute type
The trigger you can use depends on what the code runs on, and this is the part of the pattern most likely to trip you up: a new notebook attaches to serverless compute, and serverless does not allow the always-on triggers.
| Runs on | Triggers allowed | Latency | Notes |
|---|---|---|---|
| Serverless notebook or serverless job | availableNow only | However often you run it | The code above, as written. Databricks recommends availableNow here |
| Classic compute (all-purpose or job cluster) | availableNow, processingTime, continuous | Seconds with processingTime | You pay for a cluster that stays up |
| Lakeflow declarative pipeline, continuous mode | Managed for you | Seconds | What Databricks recommends for always-on streams on serverless. A different authoring model, so the notebook does not port across as-is |
availableNow processes everything waiting and then stops, so pair it with a schedule or the table update trigger from Pattern C. You keep the streaming checkpoint either way, so each run resumes exactly where the last one finished.
processingTime and continuous fail on serverlessTrigger.ProcessingTime(interval) and Trigger.Continuous(interval) are not supported in serverless notebooks or serverless jobs, so moving the same code into a serverless job will not get you past it. You get INFINITE_STREAMING_TRIGGER_NOT_SUPPORTED. Leaving the trigger off entirely fails the same way, because Spark defaults to ProcessingTime("0 seconds").
To use processingTime, attach the notebook to classic compute with the compute drop-down. For an always-on stream on serverless, use a Lakeflow declarative pipeline in continuous mode instead.
See streaming on serverless compute and trigger intervals.
Pattern C: event-driven job triggers
The middle ground, and the best default for most teams. It wakes when the source table changes instead of running continuously.
1. Prepare the source table and the Atomic webhook URL. The table needs a change data feed so the job can read what changed, and the Atomic webhook URL belongs in a secret scope rather than in the notebook:
ALTER TABLE <your-catalog>.banking.accounts
  SET TBLPROPERTIES (delta.enableChangeDataFeed = true);
databricks secrets create-scope atomic

databricks secrets put-secret --json '{
  "scope": "atomic",
  "key": "webhook_trigger_url",
  "string_value": "<your Atomic webhook URL>"
}'
2. Create a notebook and add this code. Click + New in the left sidebar and select Notebook, then set the language to Python with the selector beside the notebook name.
The job reads only the commits it has not sent yet, posts them in batches, and moves its watermark forward. The watermark is the source_version column on the atomic_send_log table:
import requests
from requests.adapters import HTTPAdapter, Retry

ATOMIC_URL = dbutils.secrets.get(scope="atomic", key="webhook_trigger_url")
BATCH_SIZE = 500
SOURCE_TABLE = "<your-catalog>.banking.accounts"
LOG_TABLE = "<your-catalog>.banking.atomic_send_log"

session = requests.Session()
session.mount("https://", HTTPAdapter(max_retries=Retry(
    total=4,
    backoff_factor=1,
    status_forcelist=[429, 500, 502, 503, 504],
    allowed_methods=["POST"],
)))


def post_to_atomic(rows):
    for start in range(0, len(rows), BATCH_SIZE):
        payload = [
            {"targetUserId": r["user_id"], "balance": float(r["balance"])}
            for r in rows[start:start + BATCH_SIZE]
        ]
        response = session.post(ATOMIC_URL, json=payload, timeout=30)
        # Raise so the job fails and the watermark stays where it was
        response.raise_for_status()


def record_watermark(version):
    spark.sql(
        f"INSERT INTO {LOG_TABLE} (sent_at, source_version) VALUES (current_timestamp(), :v)",
        args={"v": version},
    )


# Where the last run got to, and where the table is now
last_version = spark.sql(
    f"SELECT COALESCE(MAX(source_version), -1) AS v FROM {LOG_TABLE}"
).collect()[0]["v"]

latest_version = (spark.sql(f"DESCRIBE HISTORY {SOURCE_TABLE}")
                  .agg({"version": "max"})
                  .collect()[0][0])

if last_version < 0:
    # First run. Record where the table is now and send nothing, so only changes
    # made from here on are picked up. Reading from version 0 instead would fail
    # with DELTA_MISSING_CHANGE_DATA whenever the change data feed was enabled
    # after the table already had commits.
    record_watermark(latest_version)
    print(f"First run, watermark set to {latest_version}. Nothing sent.")

elif last_version >= latest_version:
    # Nothing committed since the last run. Checked explicitly, because asking for
    # a startingVersion beyond the latest version raises
    # DELTA_CDC_START_VERSION_AFTER_LATEST rather than returning no rows.
    print("Nothing new to send")

else:
    # Collected once, so the change feed is not read repeatedly. Caching the
    # DataFrame instead would fail on serverless compute, which does not allow
    # PERSIST TABLE.
    rows = (spark.read
            .option("readChangeFeed", "true")
            .option("startingVersion", last_version + 1)
            # Bound the read so the watermark matches exactly what was examined,
            # even if new commits land while this run is in flight
            .option("endingVersion", latest_version)
            .table(SOURCE_TABLE)
            .filter("_change_type IN ('insert', 'update_postimage')")
            .filter("balance < 100")
            .select("user_id", "balance")
            .dropDuplicates(["user_id"])
            .collect())

    if rows:
        post_to_atomic(rows)
        print(f"Sent {len(rows)} customers, up to commit version {latest_version}")
    else:
        print(f"Commits up to {latest_version} had nothing matching the filter")

    # Reached only if the send succeeded, so a failure leaves the watermark alone
    # and the next run retries the same commits
    record_watermark(latest_version)
Recording the watermark only after a successful post is what makes a failed run safe to retry: nothing advances, so the next run picks up the same changes.
3. Put the notebook in a job and trigger it on table updates.
- In the left navigation of your workspace, click Jobs & Pipelines, then create a job with this notebook as its task.
- In the right pane, under Schedules & Triggers, click Add trigger.
- Under Trigger type, select Table update.
- Under Tables, add the table you want to monitor. In this example that is
<your-catalog>.banking.accounts. - Click Advanced to set the two rate controls below.
- Click Test trigger to validate, then Save.
The two advanced settings are what set your latency. There is no fixed platform interval to work around, so how soon a change in Databricks becomes an Atomic card is up to you:
- Minimum time between triggers in seconds is a cooldown after the previous run finishes. Tables updated during the cooldown trigger a run once it expires.
- Wait after last change in seconds delays the run until the table has been quiet for that long, and each new change resets the timer. Use this when updates land in bursts and you want the whole burst in one run.
Set both, and the trigger waits out the cooldown first and then the quiet window. With a 120 second minimum and a 60 second wait, a change in the first 60 seconds still will not fire until 120 seconds have passed. Keep both low while testing so a change reaches Atomic within seconds.
For faster and cheaper detection on larger tables, enable file events on the external location holding the table. Databricks then tracks ingestion metadata from cloud change notifications rather than polling.
The notebook writes to atomic_send_log. If that table is in the trigger's Tables list, each run's own write fires the next one and the job never stops.
4. Prove the notebook works, before trusting the trigger. This takes three runs, and the first two are meant not to succeed. Use Run now on the job rather than waiting for the trigger.
Run one sets the baseline. It prints First run, watermark set to N. Nothing sent. and contacts Atomic not at all. The notebook only looks forward from wherever the table is when it first runs, so there is nothing to send yet.
Run two sends and fails. First give it a change to find:
UPDATE <your-catalog>.banking.accounts SET balance = 41.00;
Now Run now. The request reaches Atomic, which rejects it because there is no payload mapping yet, and raise_for_status() turns that rejection into a job failure. That is expected, and the request is still captured. Map the incoming payload using it.
Run three works. Because the watermark only moves after a successful send, this run retries the same change. It prints Sent 1 customers, up to commit version N, and in Atomic the Action Flow is triggered for the customer you targeted.
The change data feed only records changes from the version at which you enabled it. If the table already had commits by then, asking for earlier versions fails with DELTA_MISSING_CHANGE_DATA. Starting from the current version avoids that, and avoids replaying every historical change as a fresh trigger. The cost is that a first run on an unchanged table sends nothing, which is why the UPDATE above comes first.
5. Then prove the trigger fires. Make another change, without touching Run now this time:
UPDATE <your-catalog>.banking.accounts SET balance = 40.00;
Wait out the cooldown and the quiet window you configured, then open Jobs & Pipelines, select the job and look at its Runs. A run you did not start yourself is the trigger working. Confirm the watermark moved with:
SELECT * FROM <your-catalog>.banking.atomic_send_log ORDER BY sent_at DESC;
Keep each new value under 100. Set it above the threshold and the job still fires, correctly finds nothing to send, and prints Nothing new to send, which is easy to mistake for a trigger that is not working.
If your data arrives as files rather than table writes, use a file arrival trigger instead. It has the same two rate controls.
Map the incoming payload in Atomic
With the Databricks side built, Atomic needs to be told how to read what it sends. It learns the shape from a real request, so the first send is meant to fail. Work through it in this order.
1. Put the trigger into capture mode. In the Atomic Workbench, select the Webhook trigger on the Action Flow canvas. Under Sample payload, click Get sample. Atomic now waits for a request and keeps the body of the next one it receives.
2. Send a request from Databricks. Run your query, job or stream. Atomic captures the body but does not start the Action Flow, because there is no mapping yet.
3. Confirm it arrived and see the error. In Databricks, read the log table:
SELECT * FROM <your-catalog>.banking.atomic_send_log ORDER BY sent_at DESC;
The status_code and response_body columns hold Atomic's reply, which reports a payload mapping failure. That is the expected result at this stage, and it confirms the request reached Atomic rather than being blocked on the way out.
4. Map the sample. Back in Atomic, click Edit payload mapping. The Sample request panel now shows what Databricks sent, wrapped by Atomic in a body key:
{
  "body": [
    { "targetUserId": "<your-atomic-test-customer-id>", "balance": 42 }
  ]
}
Set Mapping to JavaScript, since the payload carries a batch and needs one entry per customer:
return body.map(b => ({
  targetUserIds: b.targetUserId,
  variables: {
    balance: b.balance
  }
}))
body is the array Databricks posted. Each entry needs targetUserIds; variables is optional and only needed for values you want to use in the card or in branching. See dealing with batched payloads. Add a "balance" variable in your Atomic Action Flow to use that value in an Action Flow step or card.
The other two Mapping modes are Pass-through, for when Databricks already sends exactly the shape Atomic expects, and Basic, a no-code option for picking out the customer ID and variables from a single, non-batched payload.
5. Send again. Re-run the Databricks query. The log table should now show a 2xx, and the Action Flow should be triggered for the customer you targeted. Confirm it started on the Action Flow's Runs tab, which is more reliable than watching for a card, since what the Action Flow does with the trigger is up to how you built it.
Atomic requires every entry in a mapped batch to be valid. If one row produces an invalid entry, the request is rejected and no Action Flows start, not even for the valid rows. Filter nulls out in your Databricks query rather than relying on the mapping to cope with them.
Stop duplicate sends
A scheduled query has no memory of who it contacted last run, so the same customers keep matching and keep getting cards. You can track that in Databricks, but it is usually less work to let Atomic handle it.
Set flowInvocationId in the mapping. It is the idempotency key for the request. Give it a value that is stable for a given customer and reason:
return body.map(b => ({
  targetUserIds: b.targetUserId,
  flowInvocationId: `low-balance-${b.targetUserId}`,
  variables: {
    balance: b.balance
  }
}))
Repeat a request with the same flowInvocationId and the same inputs and Atomic returns 200 without running the Action Flow again, so a retry or an overlapping schedule cannot produce a second card.
If you reuse a flowInvocationId with different inputs, the request fails validation. That matters here because balance is one of the inputs and it changes. low-balance-<customer> will start rejecting requests as soon as the balance moves, so include whatever makes the send distinct, for example the date, and treat the key as identifying one specific send rather than one customer forever.
Or use participation rules. If what you actually want is "each customer gets this Action Flow at most once", set the Action Flow's participation mode to Only once and let Atomic enforce it. That is simpler than engineering a key, and it removes the input-mismatch problem entirely. Note that Only once mode manages flowInvocationId itself and disregards any value you supply, so use one approach or the other rather than both.
If nothing arrives at all, and the log table shows a connection error rather than a response from Atomic, the request is not reaching Atomic. Check allow outbound access to Atomic from Databricks before you look at anything else.
Securing the connection
Layer on as many of these as your environment calls for.
Treat the Atomic webhook URL as a secret. The URL contains a hard-to-guess token, so anyone who has it can start your Action Flow. In Patterns B and C, keep it in a Databricks secret scope and read it with dbutils.secrets.get, which redacts the value in notebook output. In Pattern A it lives in the connection definition, see the warning above. Rotate it by recreating the trigger.
Sign your requests. Atomic can verify an HMAC signature over the request body. This is available in Patterns B and C, where you control the code.
Pick a shared secret and add it to the same secret scope you created earlier:
databricks secrets put-secret --json '{
  "scope": "atomic",
  "key": "signing_secret",
  "string_value": "<your shared signing secret>"
}'
Then sign each request with it:
import hashlib
import hmac
import json
import time

signing_secret = dbutils.secrets.get(scope="atomic", key="signing_secret")

body = json.dumps(payload)
timestamp = str(int(time.time()))
signature = hmac.new(
    signing_secret.encode(),
    f"{timestamp}.{body}".encode(),
    hashlib.sha256,
).hexdigest()

session.post(
    ATOMIC_URL,
    data=body,
    headers={
        "Content-Type": "application/json",
        "x-signature": f"v1={signature}, t={timestamp}",
    },
    timeout=30,
)
In Atomic, select the Webhook trigger on the canvas and store the same secret in its properties panel under Verify incoming request > Authentication secret, then configure the trigger's signature verification to agree with what the code sends. For the snippet above, the matching configuration is:
{
  "algorithm": "sha256",
  "digest": "hex",
  "data": {
    "signature": {
      "header": "x-signature",
      "parsePrefix": "v1="
    },
    "timestamp": {
      "header": "x-signature",
      "parsePrefix": "t="
    }
  },
  "template": "[timestamp].[payload]"
}
See additional security controls.
Restrict by IP address. You can limit the Atomic trigger to the addresses your Databricks workloads egress from. On classic compute those are your own NAT addresses. On serverless they are Databricks-managed and documented per region. Either way, treat this as ongoing maintenance rather than one-time setup, because the ranges change.
Test and go live
While the trigger is in Test mode, Atomic generates test cards and analytics rather than live ones, and only test customers can be targeted. Stay there until the whole path behaves, including whatever your Action Flow does once it is triggered.
When you are satisfied, select the trigger on the Action Flow canvas and change the mode drop-down in its properties panel to Live mode, then publish the Action Flow. Switch it back to Test mode before making further changes to a live trigger.
Part 2: writing Atomic data back to Databricks
What data is available
Atomic emits an analytics event for everything that happens to a card. The one most write-back pipelines are built for is card-completed, which carries the customer's form input under properties.values.
Choosing a path
| Path | Latency | Volume | Notes |
|---|---|---|---|
| 1. S3 export with Auto Loader | Hourly | Very high | Recommended default |
| 2. Per-event SQL statement | Seconds | Low to medium | Needs a warm warehouse |
| 3. Poll the analytics APIs | Minutes to hourly | High | No premium feature needed |
Most teams should start with Path 1 and add Path 2 only for the specific events they need in near real time.
Path 1: hourly S3 export read with Auto Loader
Atomic writes hourly analytics batch files to a bucket in your own AWS account. Databricks reads them through Unity Catalog.
In Atomic: configure the export
In the Atomic Workbench, go to Configuration > Integrations > AWS and click Connect bucket under "Write Atomic Analytics batch files in AWS S3". Pushing analytics to S3 has the full walkthrough.
Choose your format and the events you want to subscribe to at the same time. See choosing a format before you decide.
In Databricks: give Unity Catalog access to the bucket
Unity Catalog reaches the bucket through a storage credential (an IAM role) wrapped in an external location. You need CREATE STORAGE CREDENTIAL and CREATE EXTERNAL LOCATION on the metastore.
In Catalog Explorer:
- Click Catalog in the sidebar, then Connect > Credentials, and click Create credential. Choose AWS IAM Role, give it a name and your IAM role ARN, then Create. Copy the External ID from the confirmation dialog, you will need it in the role's trust policy.
- Go to Catalog > Connect > External Locations and click Create external location. Choose Manual, name it, set Storage type to S3, enter your bucket in URL, and pick the storage credential you just made.
- On the new external location's Permissions tab, grant
READ FILESto whoever runs the ingestion.
Or do the same in SQL:
CREATE EXTERNAL LOCATION atomic_analytics
  URL 's3://<your-bucket-name>'
  WITH (STORAGE CREDENTIAL <your-storage-credential>);

GRANT READ FILES ON EXTERNAL LOCATION atomic_analytics TO `<your-databricks-group-or-user>`;
Object key layout
The keys depend on the folder structure you select in the bucket configuration. Neither layout is Hive-partitioned, so Databricks will not infer a date partition from the path.
| Folder structure | Key | Example |
|---|---|---|
| Default | <org-id>/<environment-id>/<yyyyMMdd>/<HH>_<n>.<ext> | myOrg/1a2b3c/20260805/14_1.parquet |
| Root | <org-id>_<environment-id>_<yyyy-MM-dd-HH>_<n>.<ext> | myOrg_1a2b3c_2026-08-05-14_1.parquet |
A busy hour produces several files with an incrementing _n suffix, so do not assume one file per hour.
Note that the files themselves contain no organization or environment column. If you write more than one environment into the same bucket, derive it from the object key using the _metadata.file_path column.
In Atomic: choose a format
Atomic can write newline-delimited JSON, CSV or Parquet. You choose this under Data settings when connecting the bucket in Configuration > Integrations > AWS, in the same place you pick which analytics events to subscribe to.
In Databricks: ingest with Auto Loader
Auto Loader picks up new files incrementally. Put this in a notebook (+ New > Notebook in the sidebar) and run it from a job.
The example writes to <your-catalog>.atomic.analytics_bronze. toTable creates the table, but not the schema or the volume the checkpoint lives in, so create those first:
CREATE SCHEMA IF NOT EXISTS <your-catalog>.atomic;
CREATE VOLUME IF NOT EXISTS <your-catalog>.atomic.pipeline_state;
For newline-delimited JSON:
bronze = (spark.readStream
          .format("cloudFiles")
          .option("cloudFiles.format", "json")
          .option("cloudFiles.inferColumnTypes", "true")
          .option("cloudFiles.schemaLocation", "/Volumes/<your-catalog>/atomic/pipeline_state/schema/analytics")
          .option("cloudFiles.schemaEvolutionMode", "addNewColumns")
          .load("s3://<your-bucket-name>/<your-org-id>/<your-environment-id>/")
          .selectExpr("*", "_metadata.file_path AS source_file"))

(bronze.writeStream
       .option("checkpointLocation", "/Volumes/<your-catalog>/atomic/pipeline_state/checkpoints/analytics")
       .trigger(availableNow=True)
       .toTable("<your-catalog>.atomic.analytics_bronze"))
Run it hourly with availableNow, or use a file arrival trigger so ingestion starts as soon as Atomic writes. At high file counts, switch Auto Loader to file notification mode to avoid repeatedly listing the bucket.
For Parquet, set cloudFiles.format to parquet and read the next section first.
Column names in Parquet contain dots
The Parquet schema is flat, and its column names contain literal periods: properties.values, cardContext.cardTemplateId, platformContext.flowInstanceId. These are single columns, not nested structs.
Spark reads properties.values as nested field access, so it fails unless you quote it with backticks. Rename the columns once on the way in and nothing downstream has to know:
from pyspark.sql.functions import col

flattened = raw.select([
    col(f"`{name}`").alias(name.replace(".", "_"))
    for name in raw.columns
])
If you would rather be explicit about the columns you care about:
from pyspark.sql.functions import col, to_timestamp

flattened = raw.select(
    col("id"),
    col("endUserId").alias("end_user_id"),
    col("analyticsEvent").alias("analytics_event"),
    to_timestamp(col("timestamp")).alias("event_timestamp"),
    col("`properties.values`").alias("properties_values"),
    col("`cardContext.cardTemplateId`").alias("card_template_id"),
    col("`platformContext.flowInstanceId`").alias("flow_instance_id"),
    col("`platformContext.triggerEventSource`").alias("trigger_event_source"),
    col("_metadata.file_path").alias("source_file"),
)
A few other things to know about that schema:
- Timestamps are strings, not Parquet timestamps. Cast
timestamp,cardContext.publishedAtandeventContext.userLocalTimestampon the way in. - Only
id,analyticsEventandtimestampare guaranteed to be present. Everything else can be null. properties.payload,properties.values,properties.previousStatus,properties.resolvedVariables,platformContext.eventDetailandplatformContext.eventNotificationDetailhold JSON.
In Databricks: handle redaction and nulls
The JSON columns can contain the literal string [redacted] when the matching export setting is off, so parse defensively:
SELECT
  id,
  end_user_id,
  event_timestamp,
  CASE
    WHEN properties_values IS NULL OR properties_values = '[redacted]' THEN NULL
    ELSE parse_json(properties_values)
  END AS card_response
FROM <your-catalog>.atomic.analytics_bronze
WHERE analytics_event = 'card-completed'
  AND (trigger_event_source IS NULL OR trigger_event_source <> 'test');
Parsing into VARIANT with parse_json keeps you from having to pin down a schema for card responses that changes whenever someone edits a card. Use from_json with an explicit schema instead when you want the columns typed and stable.
Path 2: write each event with the SQL Statement Execution API
When you need a response in a Delta table within seconds rather than within the hour, have Atomic call Databricks directly.
Atomic can do this from either:
- a pre-configured Databricks > Run SQL statement step added to the Action Flow canvas, when you only want events from a specific Action Flow, or
- an outgoing webhook subscription, created under Configuration > Webhook subscriptions > New subscription, on the events you care about globally such as
card-completed.
The pre-configured step is the easier of the two and is worth preferring wherever an Action Flow can do the job. A webhook subscription is the answer when you want events across every Action Flow rather than one.
In Databricks: create the landing table
Everything below refers to this table, so create it first. Keep it generic: a webhook subscription can carry any event type you subscribe it to, not only card responses, so land the whole event in a VARIANT column and parse it downstream.
CREATE SCHEMA IF NOT EXISTS <your-catalog>.atomic;

CREATE TABLE IF NOT EXISTS <your-catalog>.atomic.events (
  event_id    STRING,
  event_name  STRING,
  end_user_id STRING,
  payload     VARIANT,
  received_at TIMESTAMP
);
Set up authentication in both systems
In Databricks, create a service principal for Atomic to authenticate as:
-
Click your username in the top bar and select Settings, then the Identity and access tab.
-
Next to Service principals, click Manage, then Add service principal. Note its application ID, which is how you refer to it everywhere below.
-
Give it access to the table. All four of these grants are needed.
MODIFYis what allows the insert, but Databricks also requiresSELECTon the same table, plus the ability to traverse the catalog and schema above it.GRANT USE CATALOG ON CATALOG <your-catalog> TO `<application-id>`;GRANT USE SCHEMA ON SCHEMA <your-catalog>.atomic TO `<application-id>`;GRANT SELECT ON TABLE <your-catalog>.atomic.events TO `<application-id>`;GRANT MODIFY ON TABLE <your-catalog>.atomic.events TO `<application-id>`;Miss
SELECTand the statement is accepted but fails withPERMISSION_DENIED: User does not have SELECT on Table, which reads oddly for an insert. See Unity Catalog privileges.Service principals are referenced by application ID rather than display name. The same grants can be made in Catalog Explorer: open the table, go to its Permissions tab and click Grant.
-
Give it access to the warehouse. This is a workspace permission rather than a Unity Catalog one, so there is no SQL for it. Click SQL Warehouses in the sidebar, open the kebab menu at the right of the warehouse row, choose Permissions, click Grant permission, select the service principal and give it Can use.
-
Generate an OAuth secret for it. Still on the service principal, open its Secrets tab and click Generate secret. You choose a Lifetime between 1 and 730 days, set a reminder for yourself to update the Atomic credential (added next) when this expires. Copy both the client ID and the secret now, because the secret is shown only once. The client ID is the same value as the application ID from step 2.
- Rotating is not disruptive: generate a new secret first, update the client secret on the Atomic credential, confirm a test event still lands, then delete the old secret. Because the credential is shared, that one update covers every subscription and step using it.
In Atomic, turn those into a reusable credential:
- Go to Configuration > Integrations > Credentials and click New credential.
- Choose Client credentials (OAuth).
- Set the identity URL to
https://<your-workspace-host>/oidc/v1/token. - Enter the client ID and client secret from step 5 above.
- Set the scope to
all-apis. - Choose the POST with body parameters request scheme.
Atomic exchanges the client credentials for a short-lived access token as needed and attaches that as the bearer token, so what travels on each request expires in an hour rather than being a long-lived secret. See credentials for the full list of options. One credential covers every webhook subscription and Send request step that talks to this workspace.
In Atomic: send the statement to Databricks
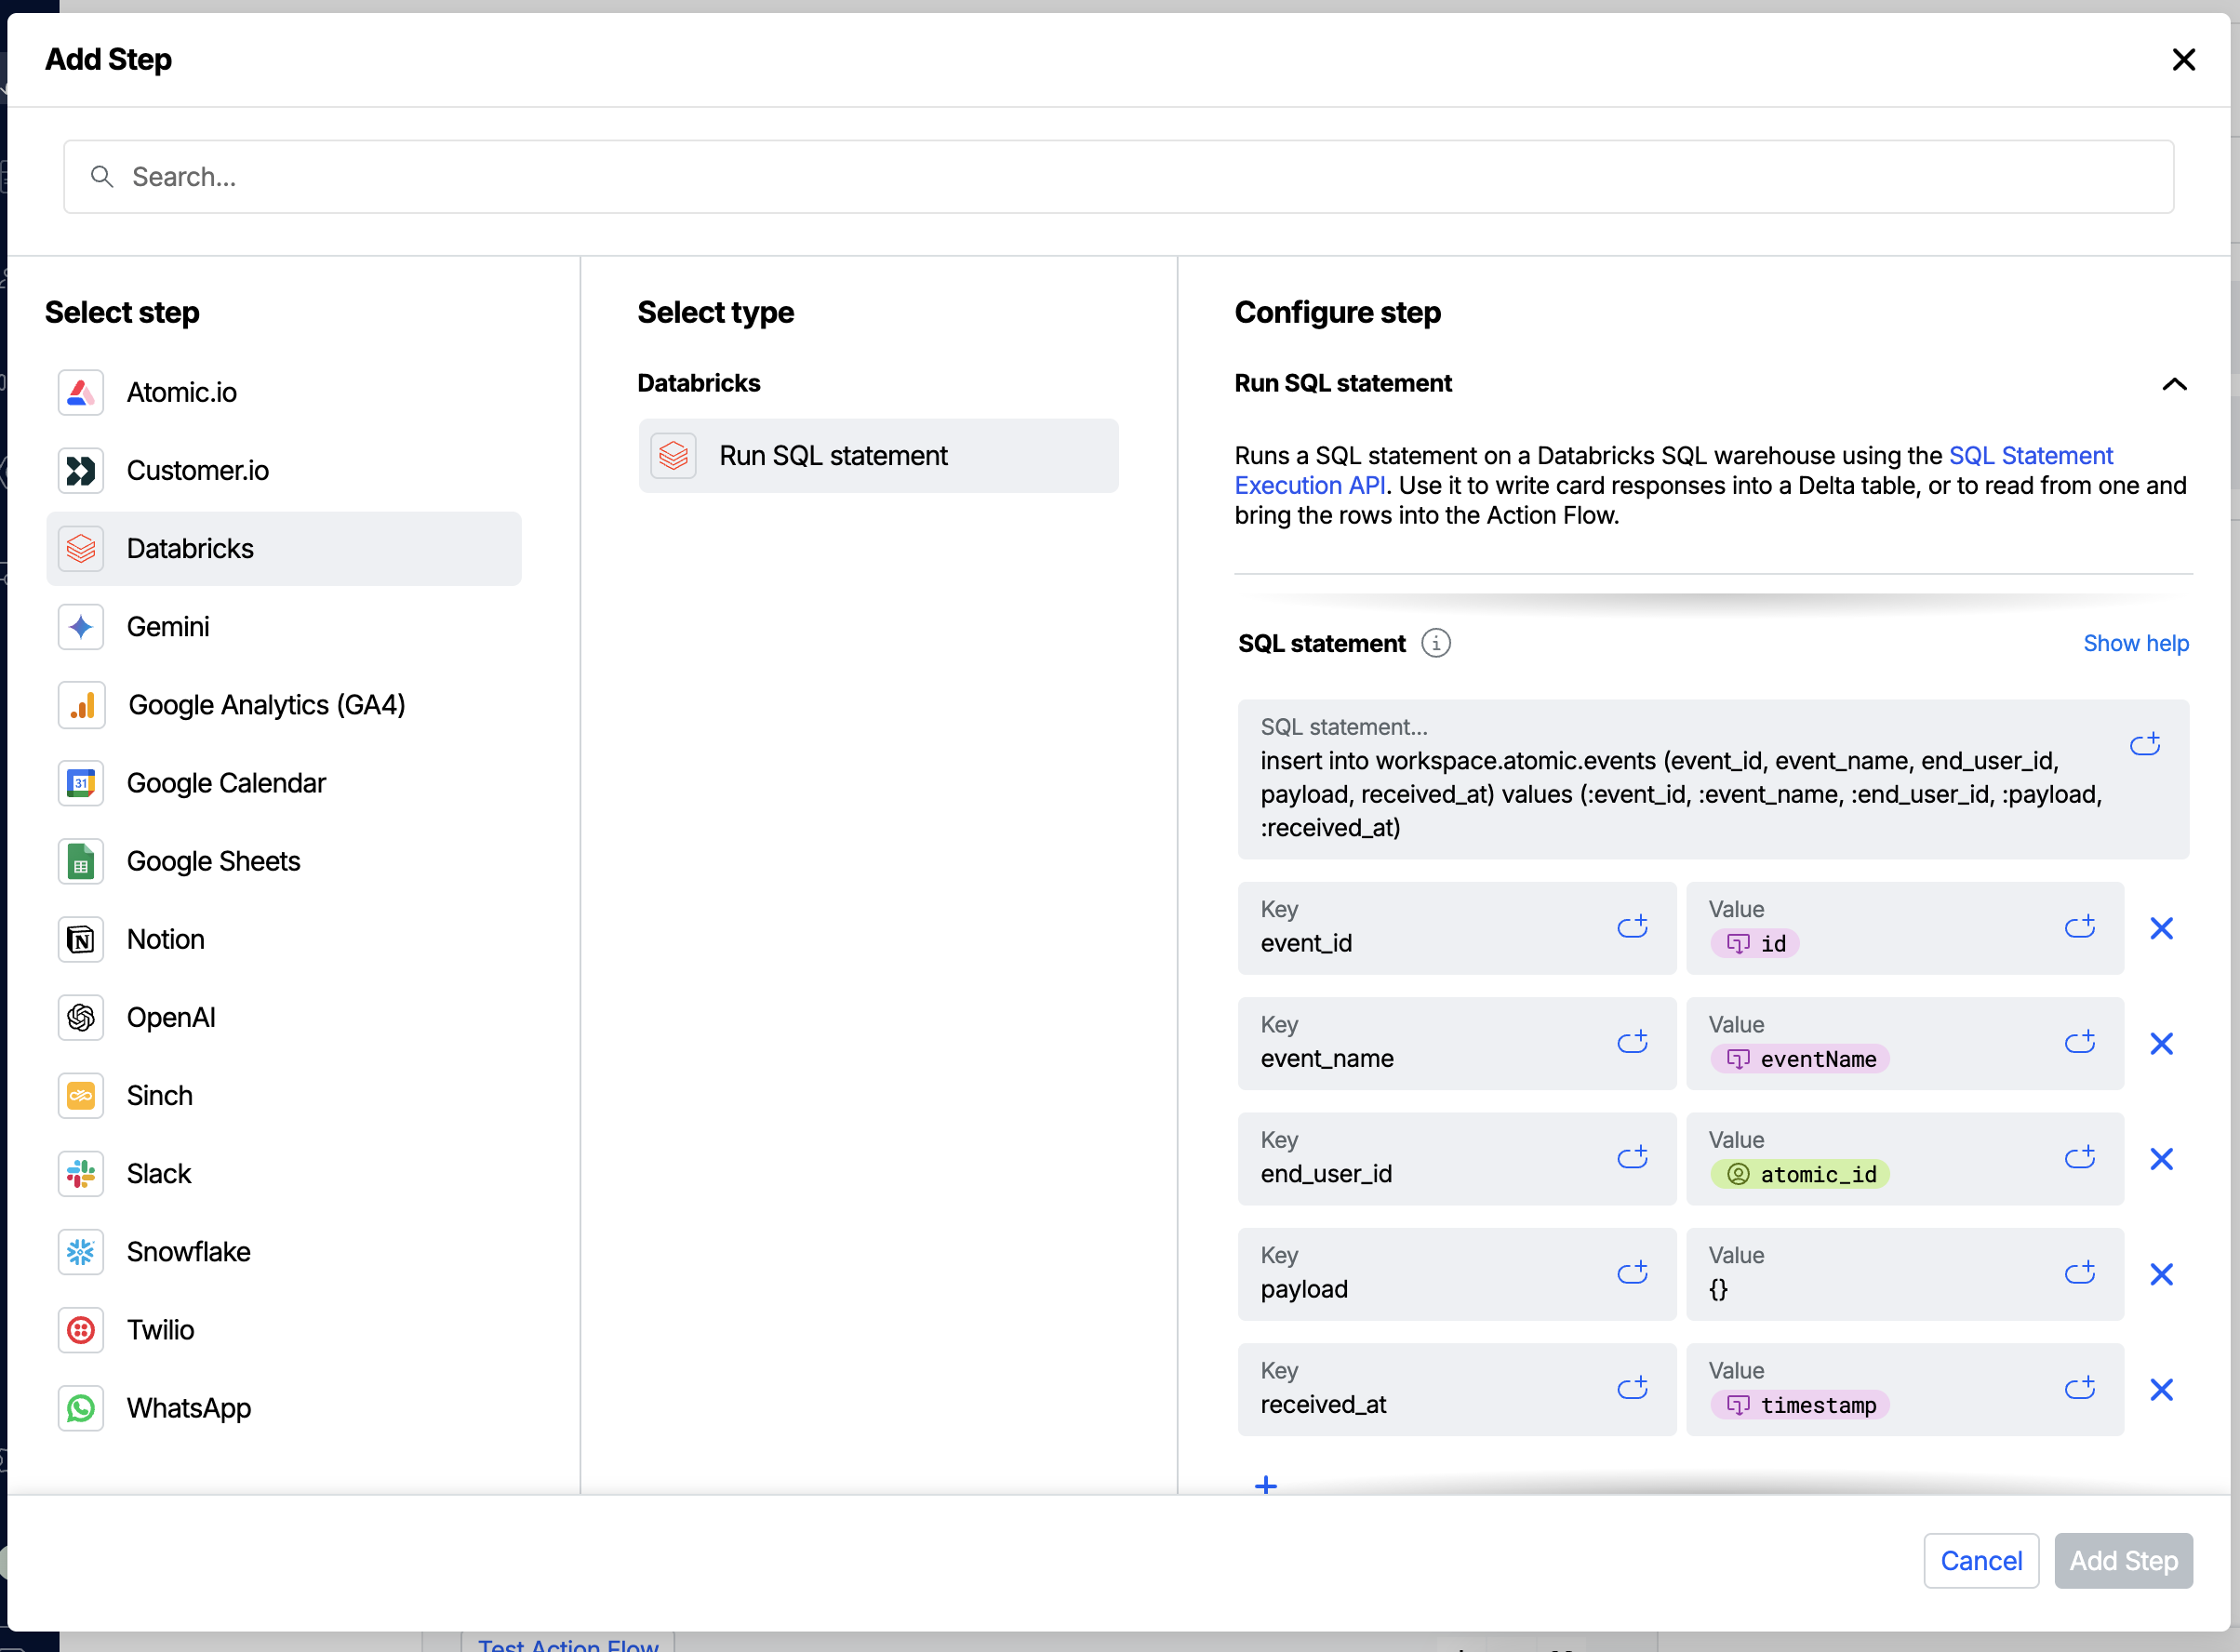
Inside an Action Flow, use the pre-configured Databricks step. Add a step, choose Databricks > Run SQL statement, and fill in the connection details, your statement and its parameters. It builds the request for you, and its response mapping already lifts the statement's state and any error message into Action Flow context, which matters more here than it sounds, see failure handling below.
You will need your warehouse_id. Click SQL Warehouses in the Databricks sidebar and open the warehouse: the Overview tab shows the ID in brackets after the warehouse name.
The warehouse ID sits next to the name on the warehouse's Overview tab
If you wish to use an outgoing webhook subscription from Atomic instead of an Action Flow send-request step, point the webhook at https://<your-workspace-host>/api/2.0/sql/statements/ with a POST and the body below.
{
  "warehouse_id": "<your-warehouse-id>",
  "catalog": "<your-catalog>",
  "schema": "atomic",
  "wait_timeout": "30s",
  "on_wait_timeout": "CONTINUE",
  "statement": "INSERT INTO events (event_id, event_name, end_user_id, payload, received_at) VALUES (:event_id, :event_name, :end_user_id, parse_json(:payload), current_timestamp())",
  "parameters": [
    {"name": "event_id", "value": "9f8c2a51-4e6b-4c1a-9d3f-72b0c8a1e5d4"},
    {"name": "event_name", "value": "card-completed"},
    {"name": "end_user_id", "value": "user-123"},
    {"name": "payload", "value": "{\"values\":{\"rating\":\"5\"}}"}
  ]
}
The payload value goes through parse_json, so it has to be a valid JSON string with its quotes escaped, as above. A placeholder that is not valid JSON fails with INVALID_INLINE_TABLE.FAILED_SQL_EXPRESSION_EVALUATION, which is easy to read as a problem with the statement rather than with the value. If you would rather the insert never fail on a malformed payload, make the column STRING, drop the parse_json, and parse it downstream instead.
Map the Atomic event fields into those parameters values. Use the parameters array rather than building the statement by string substitution: event payloads contain customer-supplied text, and parameters keep that text from being interpreted as SQL.
Things worth deciding up front:
- Land the raw event and parse later. Writing the payload into a
VARIANTorSTRINGcolumn means a change to Atomic's payload cannot break ingestion. on_wait_timeout.CONTINUEleaves a slow statement running and returns astatement_id, which is what you want for an insert.CANCELthrows the work away.- Warehouse cost. One statement per event keeps a warehouse warm. If volume grows, insert into a staging table and merge on a schedule, or move to one of the batch paths.
- Failure handling. A failed statement still returns
200 OK, withstatus.stateset toFAILEDin the body, so response codes alone will not tell you whether the row was written. The pre-configured step mapsstate,errorMessageandstatementIdinto context for you, so branch onstateto catch it. If you built the request by hand, map the response yourself rather than trusting the status code. Either way, set acceptable response codes and add an error handler to cover outages. - IP access lists. If your workspace has one, allow Atomic's outbound static IP addresses.
Path 3: pull from Atomic instead
If you would rather keep the schedule on the Databricks side, or you do not have the S3 export enabled, poll Atomic instead. Both analytics endpoints are available: recent analytics for a filtered list of the latest events, and batched analytics for hourly files.
Expect to do this from a notebook in Python rather than in SQL. The batched endpoint returns pre-signed URLs rather than the events themselves, and Spark cannot read those directly, so something has to fetch each file and land it somewhere Spark can see, such as a Unity Catalog volume. From there the Auto Loader setup in Path 1 applies unchanged.
Authenticate with API credentials, and allow egress to the Atomic API host and the token endpoint as described in allow outbound access to Atomic from Databricks.